> ## Documentation Index
> Fetch the complete documentation index at: https://docs.picsy.uk/llms.txt
> Use this file to discover all available pages before exploring further.
# The analysis workspace
> A quick tour of the controls you will use when analysing a site.
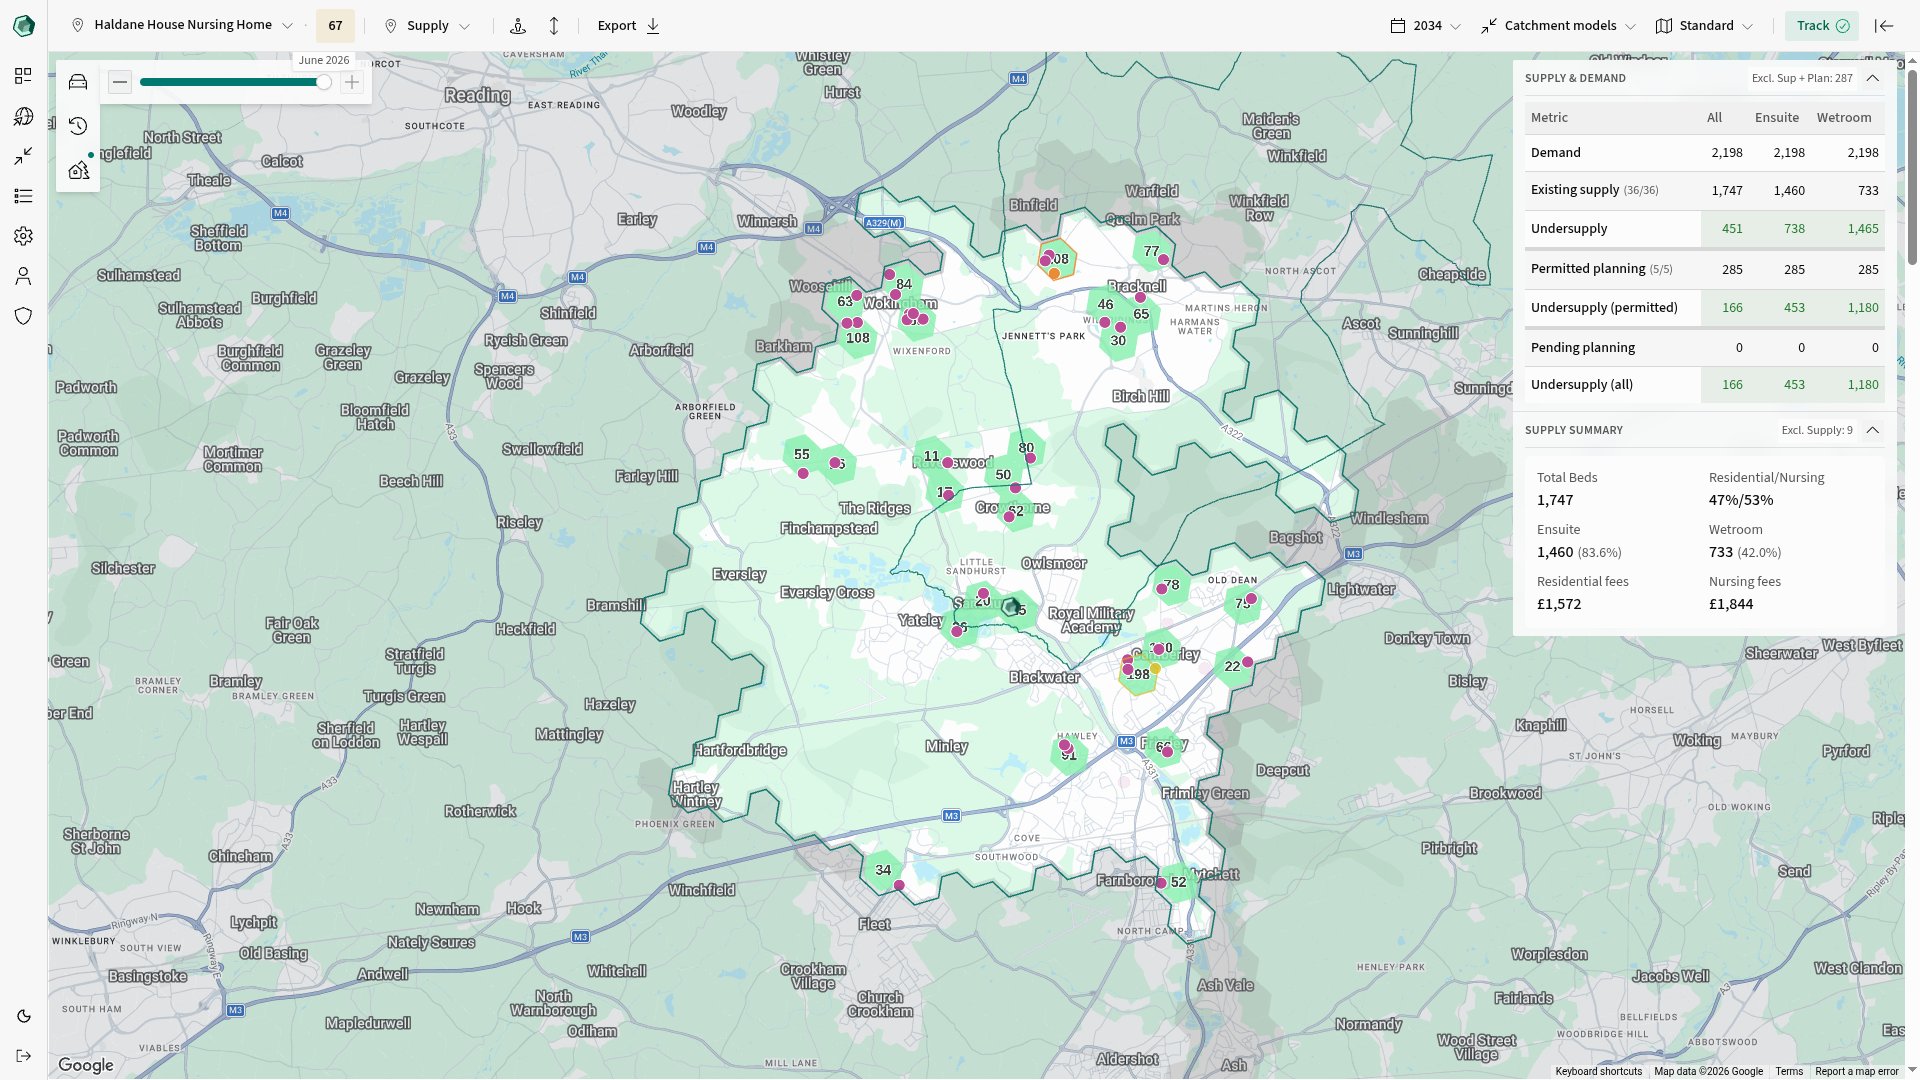
Use the analysis workspace to explore the site, adjust its catchment and review the results.
 ## Choose a view
Use the selector beside the site name to move between views such as **Demographics**, **House Prices**, **Supply**, **Planning Constraints** and **Staffing/Access**.
The active view controls which figures, tables and map layers appear. The views available to you may vary.
## Set the analysis
Use the controls above the workspace to change:
* **Projection year** sets the year used for projected population figures.
* **Comparison** sets the area, catchment model or target used as a reference.
* **Map style** changes the base map behind your analysis.
These controls change the analysis, not the site's saved location.
## Work with the map
Use the map to explore the site, its catchment and nearby records. Open **Layers** to show or hide the layers available for the current view.
Open **Catchment settings** to change the catchment type and range. You can also edit individual hexes and save useful catchments.
## Read the analysis
The data panels contain the figures, charts and tables for the current view. **Demographics**, for example, can include headline measures, regional comparisons, an age profile and population projections.
The panels update when you change the view, catchment, projection year or comparison. When a figure includes a comparison, PICSy shows the current catchment value alongside the selected reference.
## Export your work
Open **Export** to create a PDF report or download an Excel workbook.
Choose the catchment type and range for the analysis.
Include or exclude individual hexes and nearby built-up areas.
When you are ready to share the results, [export the analysis](/analysis/export).
## Choose a view
Use the selector beside the site name to move between views such as **Demographics**, **House Prices**, **Supply**, **Planning Constraints** and **Staffing/Access**.
The active view controls which figures, tables and map layers appear. The views available to you may vary.
## Set the analysis
Use the controls above the workspace to change:
* **Projection year** sets the year used for projected population figures.
* **Comparison** sets the area, catchment model or target used as a reference.
* **Map style** changes the base map behind your analysis.
These controls change the analysis, not the site's saved location.
## Work with the map
Use the map to explore the site, its catchment and nearby records. Open **Layers** to show or hide the layers available for the current view.
Open **Catchment settings** to change the catchment type and range. You can also edit individual hexes and save useful catchments.
## Read the analysis
The data panels contain the figures, charts and tables for the current view. **Demographics**, for example, can include headline measures, regional comparisons, an age profile and population projections.
The panels update when you change the view, catchment, projection year or comparison. When a figure includes a comparison, PICSy shows the current catchment value alongside the selected reference.
## Export your work
Open **Export** to create a PDF report or download an Excel workbook.
Choose the catchment type and range for the analysis.
Include or exclude individual hexes and nearby built-up areas.
When you are ready to share the results, [export the analysis](/analysis/export).