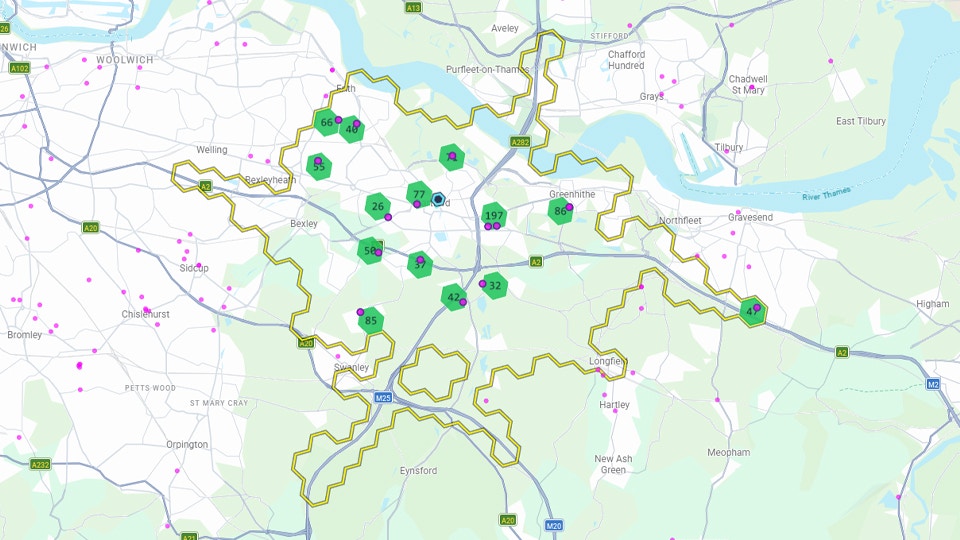
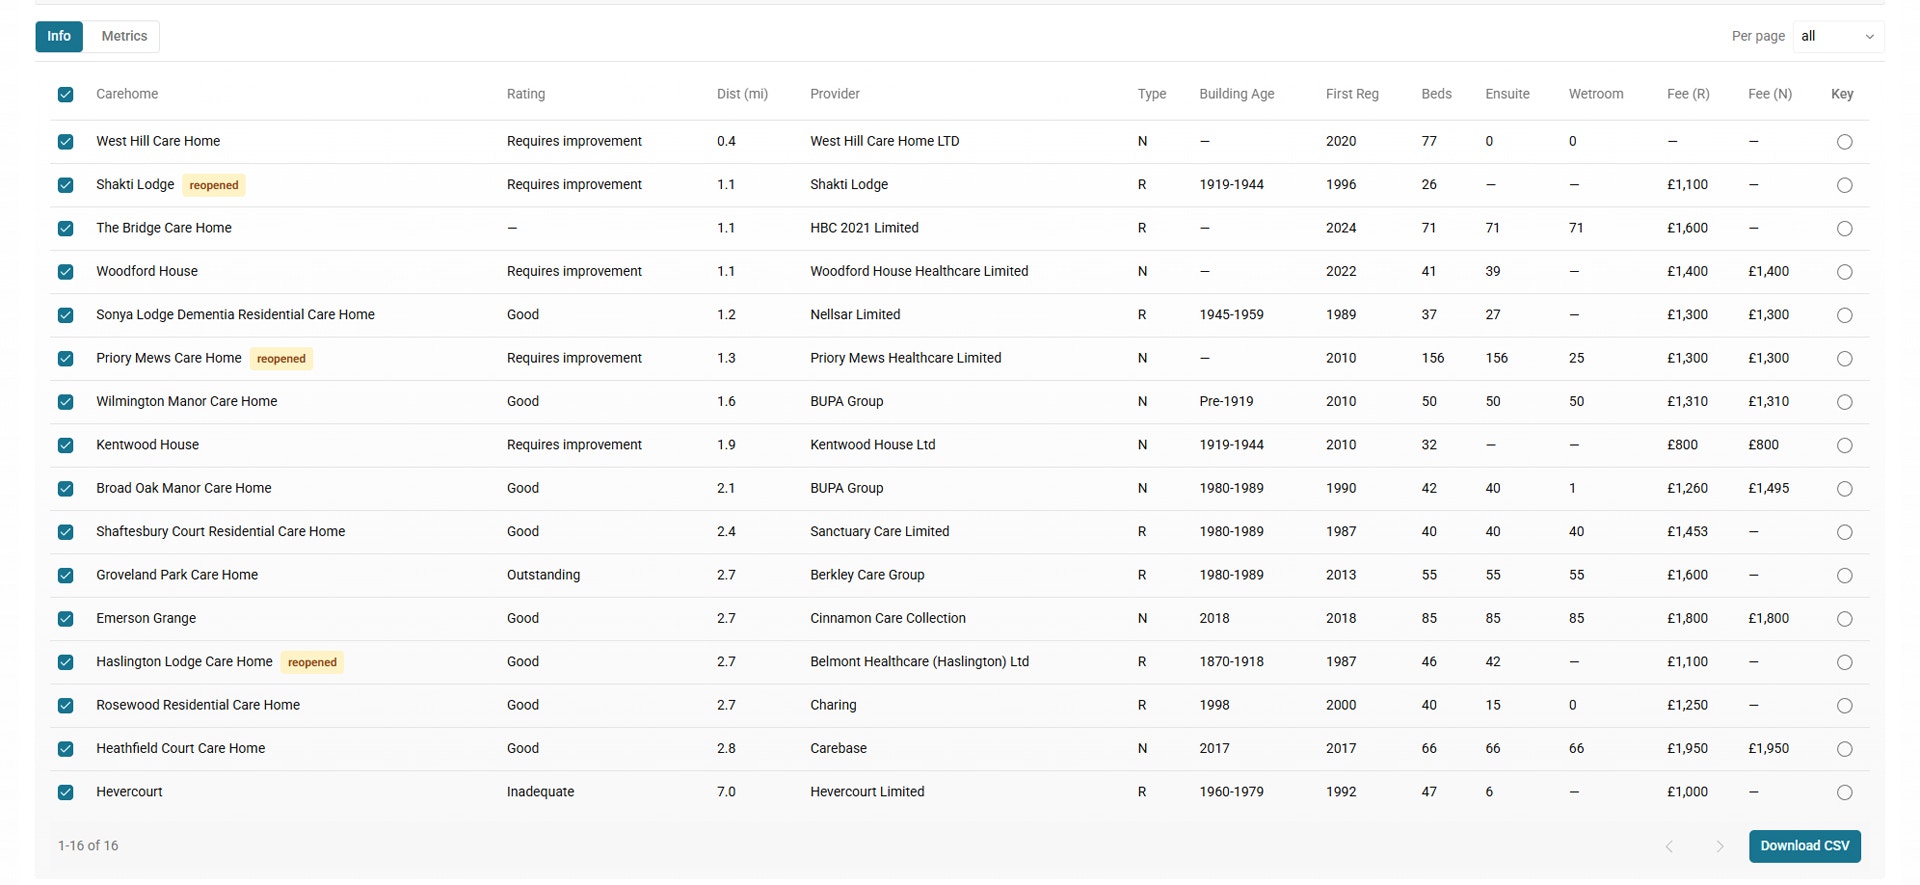
Supply List
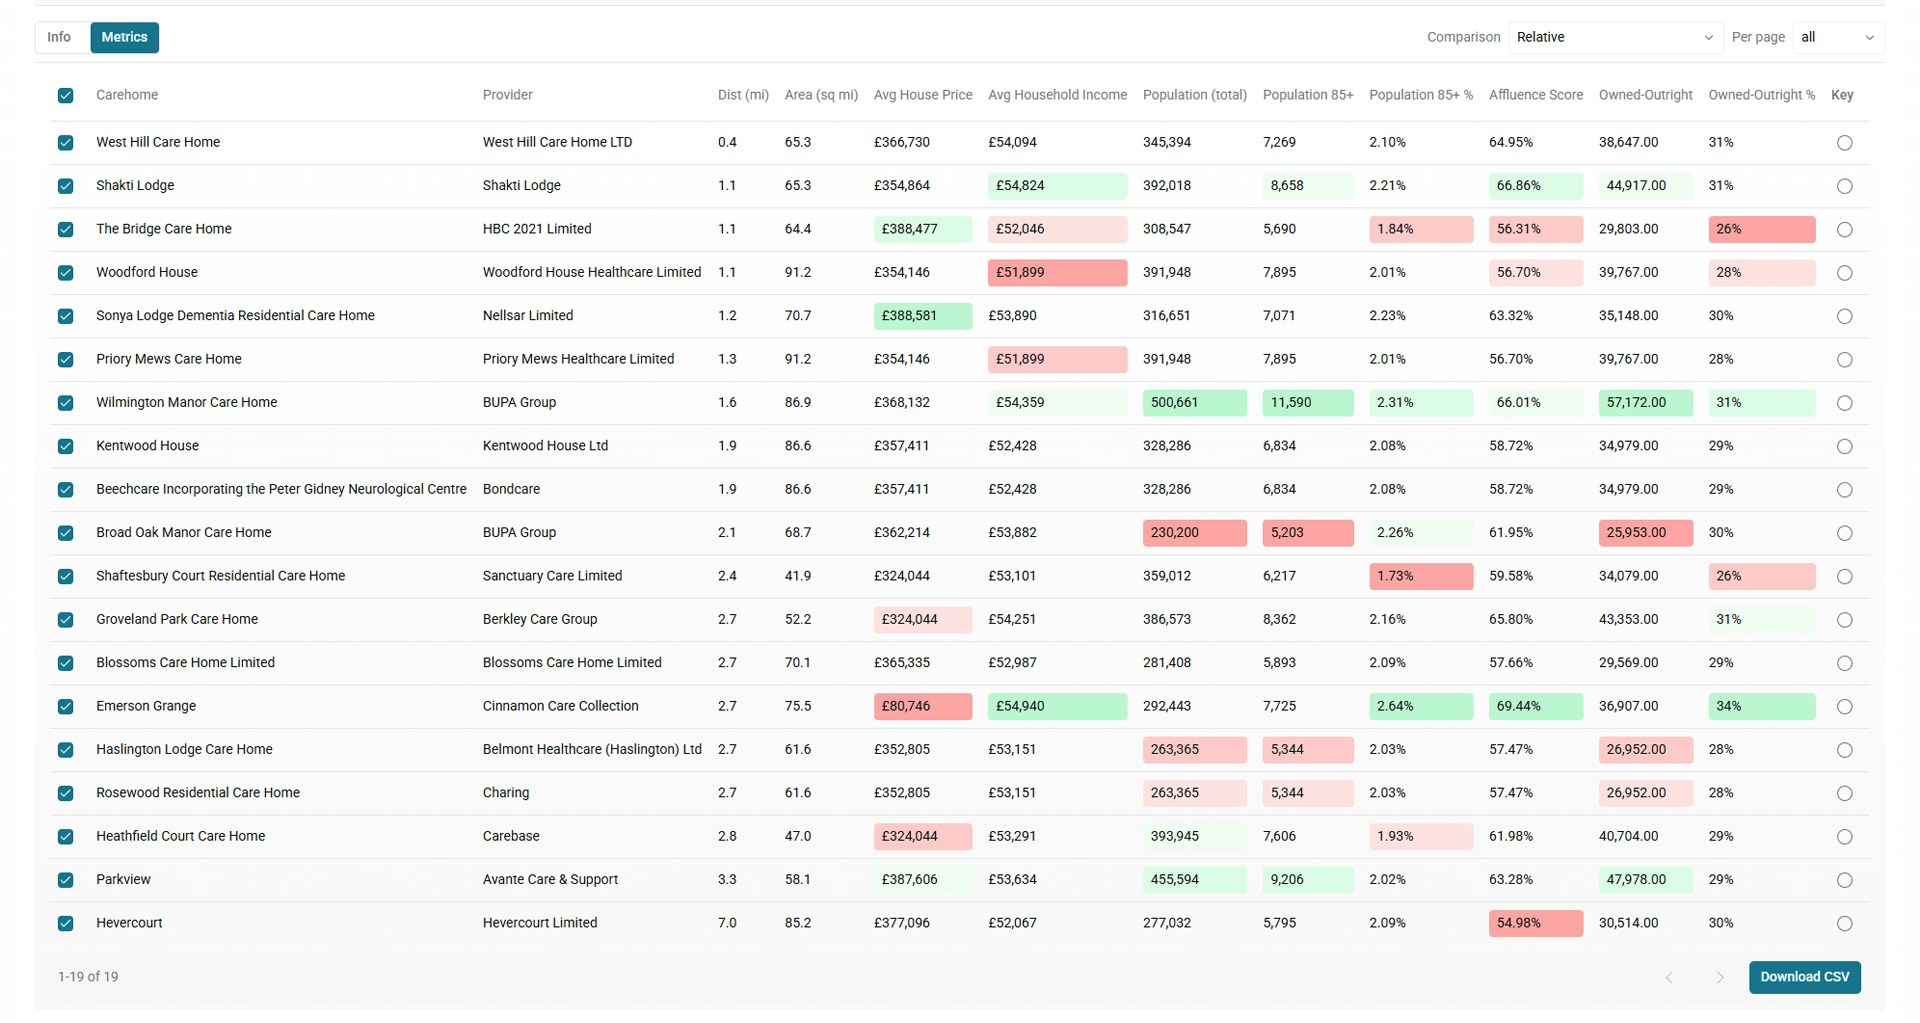
Supply List: Metric View
Supply List: Download to CSV
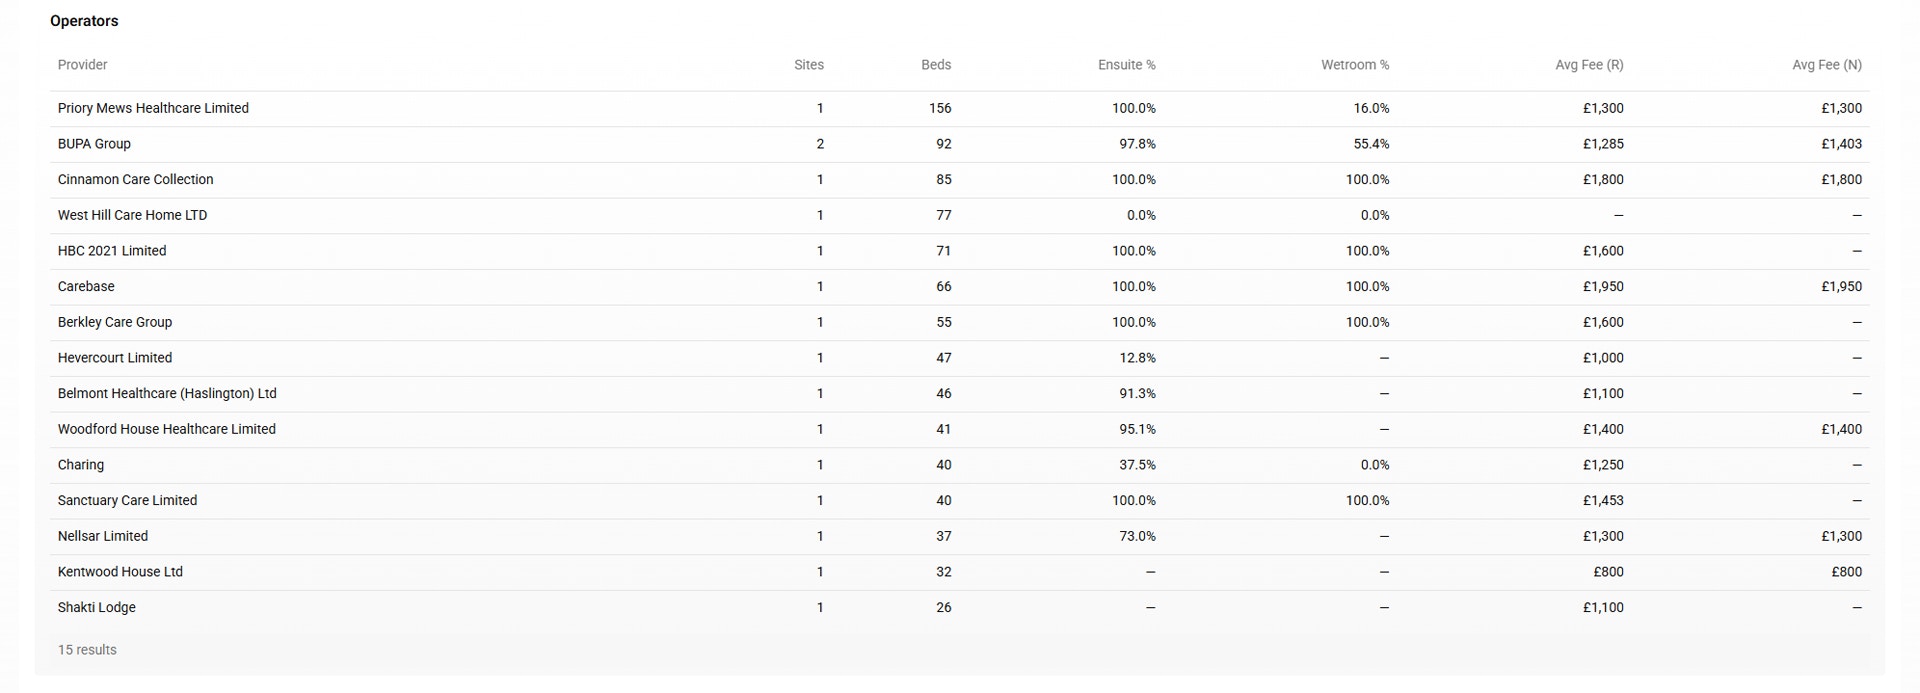
The list can be downloaded to CSV for use in your own analytics. The download includes full care home details and all metrics.Operator List
Bed Mix Tables
The Regional Occupancy chart shows reported occupancy by different region types since 2023. You can toggle the different lines on this chart on/off by clicking on the names in the legend under the chart.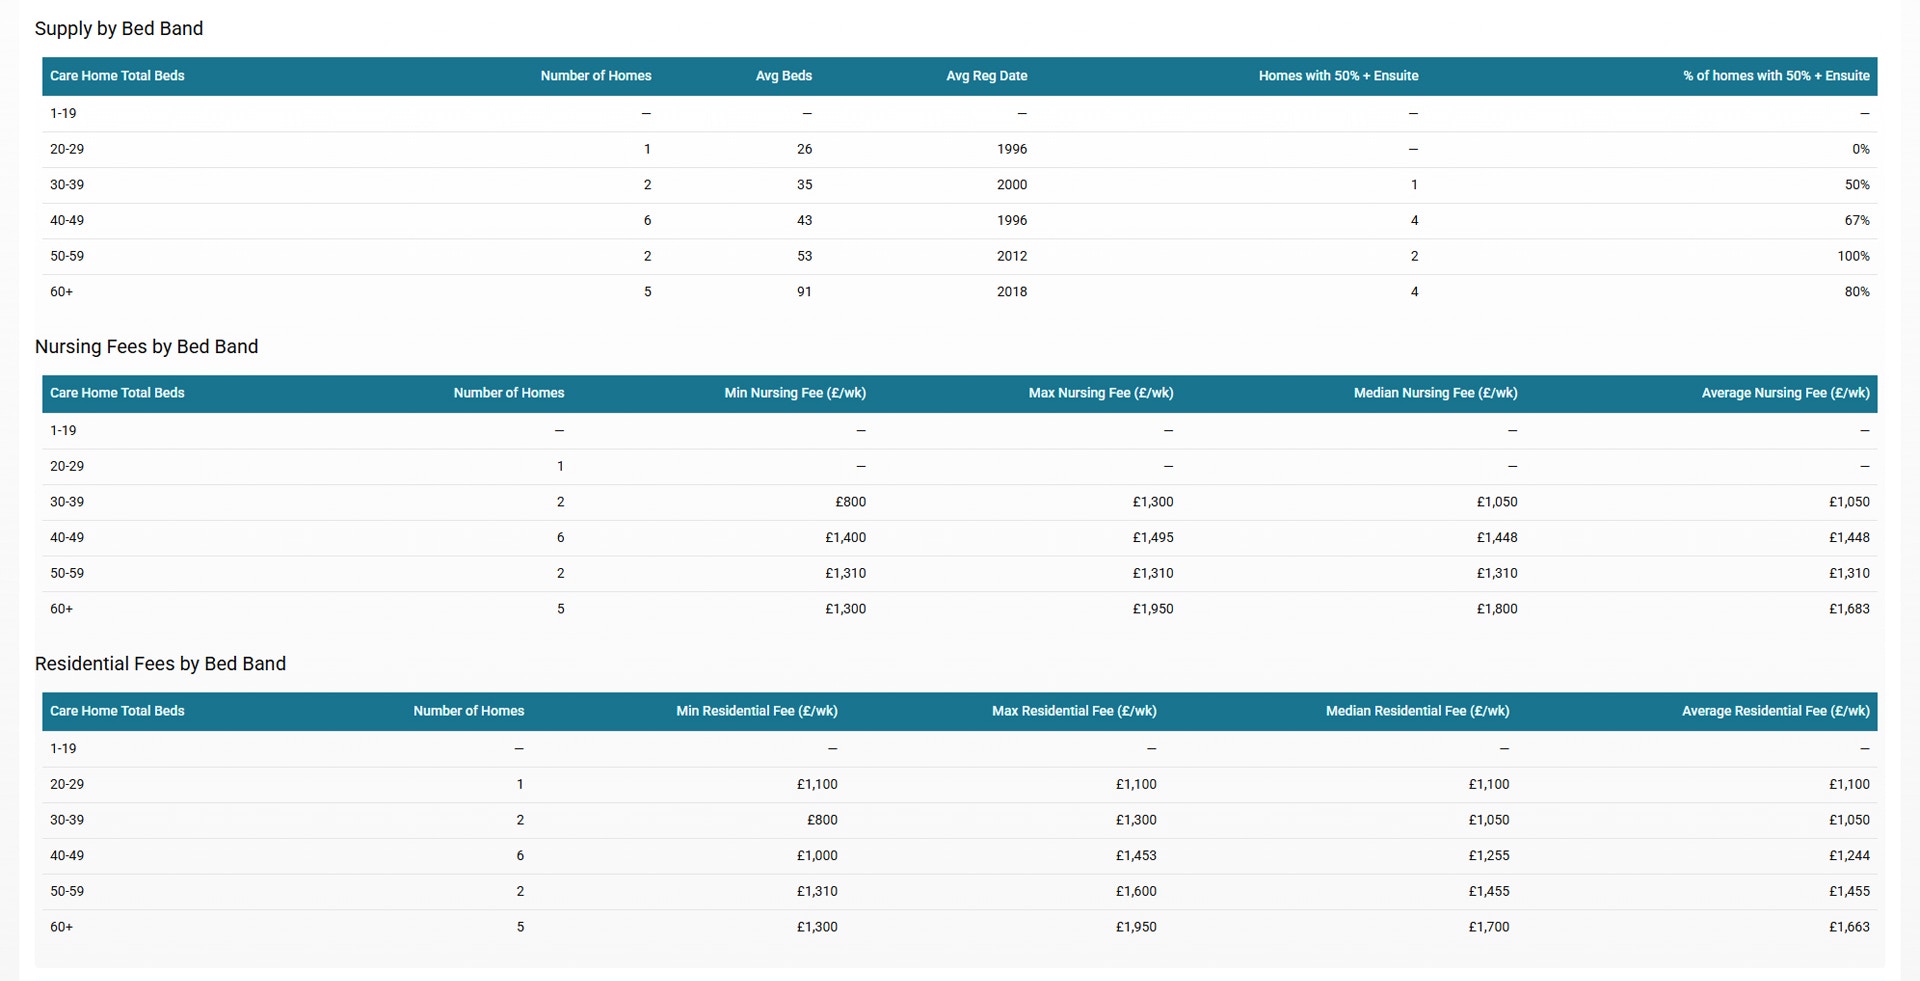
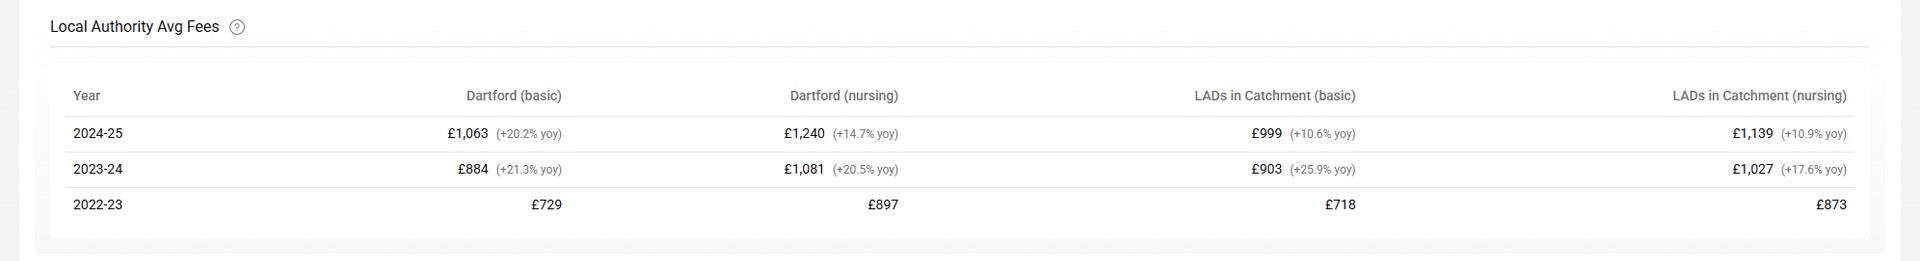
Local Authority Fees