
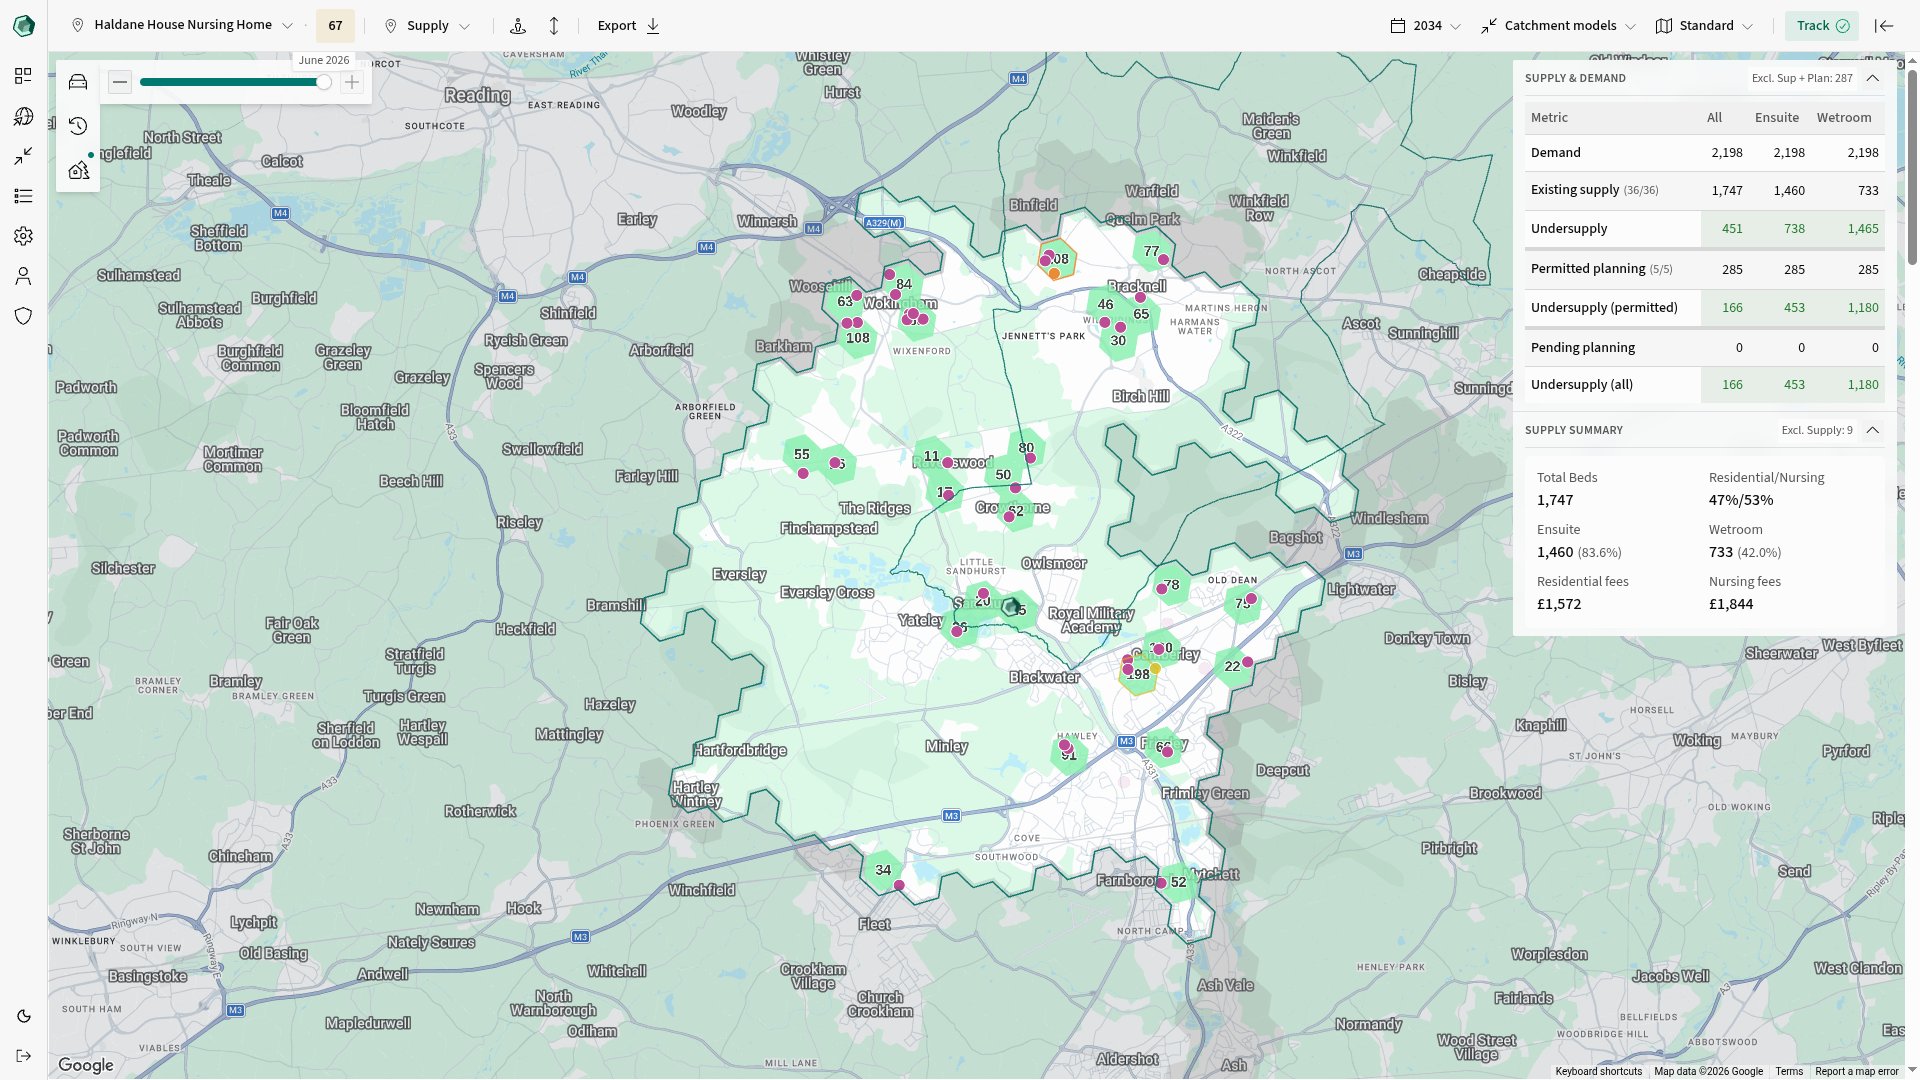
Choose a view
Use the selector beside the site name to move between views such as Demographics, House Prices, Supply, Planning Constraints and Staffing/Access. The active view controls which figures, tables and map layers appear. The views available to you may vary.Set the analysis
Use the controls above the workspace to change:- Projection year sets the year used for projected population figures.
- Comparison sets the area, catchment model or target used as a reference.
- Map style changes the base map behind your analysis.
Work with the map
Use the map to explore the site, its catchment and nearby records. Open Layers to show or hide the layers available for the current view. Open Catchment settings to change the catchment type and range. You can also edit individual hexes and save useful catchments.Read the analysis
The data panels contain the figures, charts and tables for the current view. Demographics, for example, can include headline measures, regional comparisons, an age profile and population projections. The panels update when you change the view, catchment, projection year or comparison. When a figure includes a comparison, PICSy shows the current catchment value alongside the selected reference.Export your work
Open Export to create a PDF report or download an Excel workbook.Configure a catchment
Choose the catchment type and range for the analysis.
Edit a catchment
Include or exclude individual hexes and nearby built-up areas.