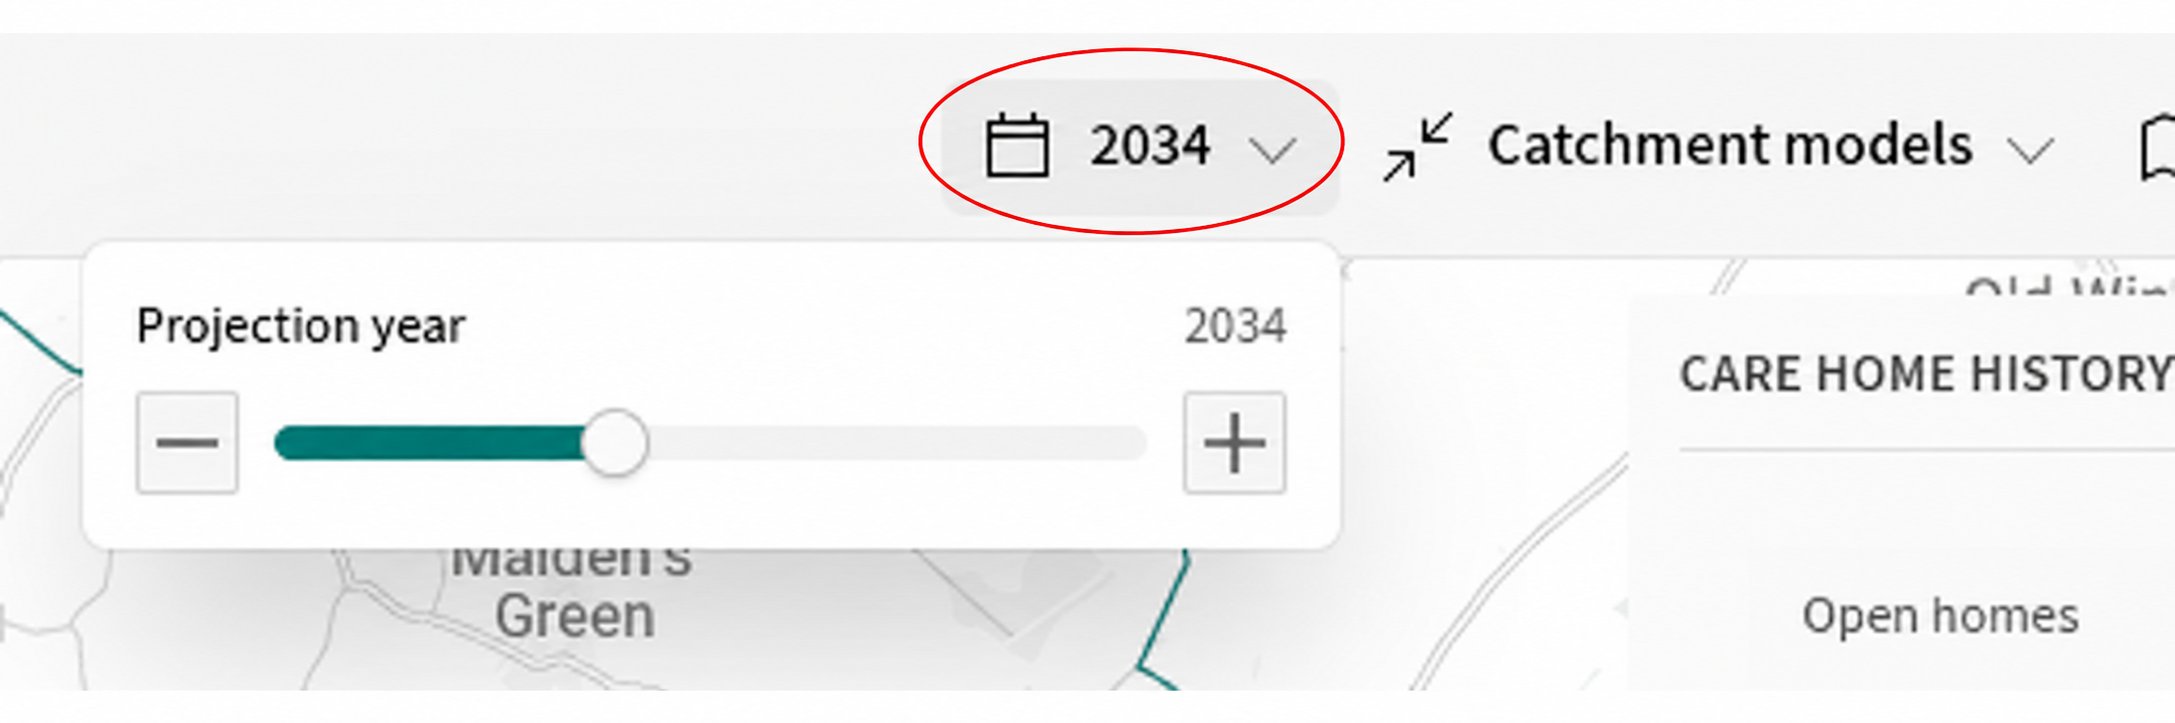
Use the controls at the top of the analysis workspace to change the time period and reference shown alongside your catchment. On a smaller screen, open Analysis settings to find the same controls.

Change the projection year

  1. Select the year shown in the workspace header.
  2. Use the minus and plus buttons, or drag the Projection year slider.
  3. Check the updated figures and charts.
Year selector circled in red, with the Projection year slider and minus and plus buttons open below it. The selected year applies to measures built from population projections. Measures tied to a fixed source year keep the date shown in their title.

Compare with an area

  1. Open Comparison.
  2. Select Area.
  3. Choose the area or catchment model you want to use.
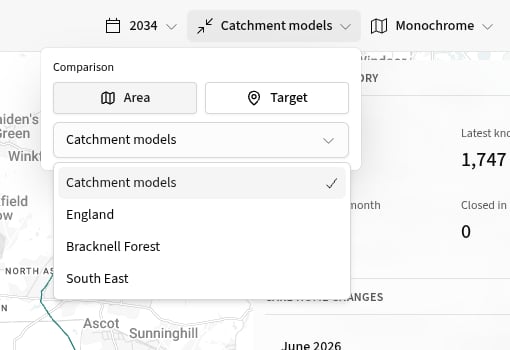
Comparison controls with Area selected and the available reference areas listed. The list only shows references available for the current site. Depending on its location, this can include catchment models, its local authority, county, region or a national baseline.

Compare with another target

  1. Open Comparison and select Target.
  2. Search for a saved site, address, care home or planning application.
  3. Select the right result.
  4. Set the catchment type and range for the comparison target.
The target’s catchment is independent of the current site’s catchment. Changing it does not alter your main analysis boundary. After selecting a target, use Toggle comparison map in the header to open or close its map. Select Clear in the comparison controls when you no longer need the target.

Check the result

Figures and tables that support comparisons update to use your selection. The map also shows the comparison target where it is relevant. Next, learn how to adjust map settings.